Gramex Charts
Gramex is agnostic to client-side charting libraries. Here are a set of recommended libraries.
Vega
Vega is a high-level implementation of the grammar of graphics, allowing the creation of charts with the power of D3 but with greater ease.
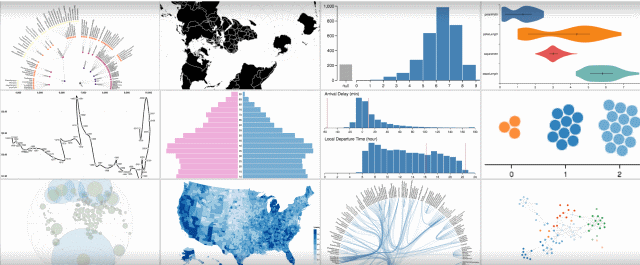
Here is a gallery of Vega charts you can use as a starting point.
To learn Vega, read the Vega tutorial.
D3
D3 is a powerful low-level JavaScript library that can bind visual features to data, allowing creation of custom charts.
Gramex Charts
Gramex Charts is a Gramener JavaScript charting library aimed at creating extensible visualizations. It is designed keeping these principles in mind:
- Charts are REACTIVE. If called repeatedly, they must update, not add / rebuild.
- Charts are BOUND. Multiple charts can be bound to a dataset and vice versa.
- Charts are RESPONSIVE. They resize with their container.
- Charts are INSPECTABLE. They expose their internals as properties.
- Charts are EXTENDABLE. They only add container nodes (e.g.
<g>) in the data join, allowing any other elements to be added afterwards. - Charts are MODIFIABLE. Chart internals are available. Developers can externally modify the chart attributes